Thaisan Tonthat | Writing
Which model is the better stockpicker?
Motivation:
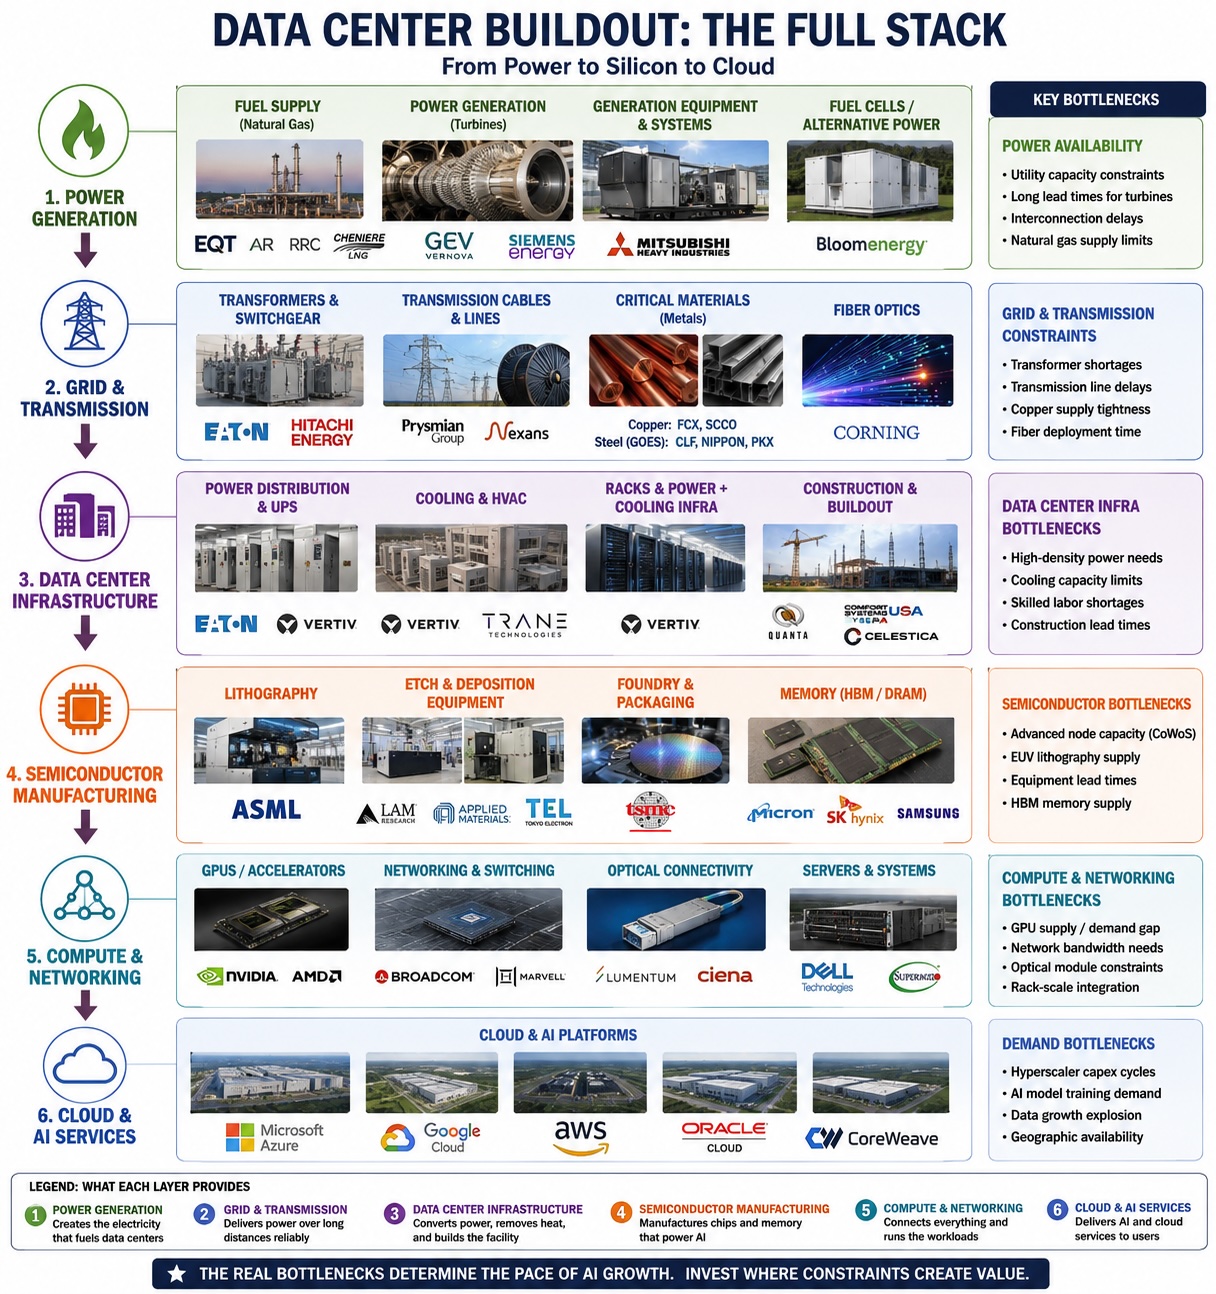
I was curious to learn more about the physical components that power AI, so I spent 30 minutes asking ChatGPT about what goes into a data center, how they are built, etc. I dug into the components and potential bottlenecks from GPUs to electrical to cooling to power and down to the turbine blades.
The thought occurred to me: If we believe that there will be a datacenter boom, what companies stand to benefit? What if we compared ChatGPT and Claude on stockpicking performance? I am not a professional public markets investor and this is mostly for fun, but it gives me the opportunity to have skin in the game, learn more about the datacenter space, and play around wrangling multiple tools.
Process and results:
I asked ChatGPT to come up with a big list of companies in the datacenter supply chain. After a lengthy dialogue with ChatGPT, I asked it to summarize what we discussed, including company names and bottlenecks.
Using Codex and starting with that CSV list generated by the chat thread, I enriched the data by grabbing financial metrics and analyst recommendations from Robinhood
available at https://robinhood.com/us/en/stocks/[ticker]/
Most stocks have a tally of how many analysts think the stock is a Buy, Hold, or Sell.
Using the formula:
1 x %Buy + 3 x %Hold + 5 x %Sell
I calculated an analyst score as a single number (lower is better).
I asked Codex to grab the data for each stock, compute the analyst score, and put it into a sortable HTML table.
Codex one-shotted it after doing some planning with me.
Note: Because I knew this would be a one-off project, I was ok with taking a snapshot of data on May 1, 2026. I arbitrarily picked the scoring formula to try out, but it would be trivially easy to use a different score such as Target Price.
I had to do some manual cleanup when some values came back as N/A. These stocks are not available on Robinhood so I either removed them or corrected them with the available equivalents.
| TSMC | TSM | Foundry | Chip manufacturing and packaging | $397.32 | 32.92 | 2.06T | 97.9% | 2.1% | 0% | 104 |
| Celestica | CLS | Manufacturing | Electronics manufacturing | $419.96 | 49.50 | 48.18B | 96% | 4% | 0% | 108 |
| Broadcom | AVGO | Networking | Switch silicon and custom AI chips | $420.61 | 81.43 | 1.99T | 94.4% | 5.6% | 0% | 111 |
| Micron Technology | MU | Memory | DRAM and HBM | $541.13 | 24.42 | 611.64B | 92% | 8% | 0% | 116 |
| Comfort Systems USA | FIX | Infrastructure | HVAC contractor | $1,873.15 | 53.12 | 65.72B | 90% | 10% | 0% | 120 |
| Cheniere Energy | LNG | Fuel | LNG export terminals | $270.06 | 11.40 | 56.75B | 88.9% | 11.1% | 0% | 122 |
| Hitachi | HTHIY | Grid | Transformers and HVDC (ADR) | $30.57 | 26.56 | 138.67B | 88.2% | 11.8% | 0% | 124 |
| Energy Transfer | ET | Fuel | Midstream pipelines | $19.96 | 16.69 | 68.62B | 86.4% | 13.6% | 0% | 127 |
| POSCO Holdings | PKX | Materials | Steel and electrical steel | $78.68 | 51.90 | 24.47B | 82.6% | 17.4% | 0% | 135 |
| Howmet Aerospace | HWM | Industrial | Turbine castings | $239.56 | 65.52 | 95.98B | 81.5% | 18.5% | 0% | 137 |
| Chesapeake Energy | EXE | Fuel | Natural gas | $99.26 | 7.61 | 23.95B | 80.6% | 19.4% | 0% | 139 |
| Applied Materials | AMAT | Equipment | Semiconductor tools | $388.98 | 40.41 | 308.75B | 80.6% | 19.4% | 0% | 139 |
| Marvell Technology | MRVL | Networking | Networking and custom silicon | $164.61 | 53.79 | 144.24B | 82.2% | 15.6% | 2.2% | 140 |
| Advanced Micro Devices | AMD | Compute | CPUs and GPUs | $360.60 | 133.78 | 587.82B | 78.6% | 21.4% | 0% | 143 |
| Tokyo Electron | TOELY | Equipment | Semiconductor tools (ADR) | $153.32 | 38.61 | 143.51B | 78.3% | 21.7% | 0% | 143 |
| ASML | ASML | Equipment | EUV lithography | $1,429.79 | 47.94 | 552.40B | 82.2% | 13.3% | 4.4% | 144 |
| Lumentum | LITE | Networking | Optical components | $951.68 | 275.91 | 67.80B | 76.9% | 23.1% | 0% | 146 |
| DuPont | DD | Materials | Specialty materials | $46.24 | -24.48 | 18.96B | 75% | 25% | 0% | 150 |
| Equinix | EQIX | Data Center | Colocation | $1,085.03 | 74.88 | 107.06B | 78.1% | 18.8% | 3.1% | 150 |
| Seagate Technology | STX | Storage | HDD | $727.89 | 63.94 | 163.00B | 78.6% | 17.9% | 3.6% | 150 |
| Vertiv | VRT | Grid/Data Center | UPS systems and cooling | $329.02 | 82.46 | 126.05B | 78.6% | 17.9% | 3.6% | 150 |
| Western Digital | WDC | Storage | HDD and NAND | $428.95 | 25.94 | 146.41B | 78.6% | 17.9% | 3.6% | 150 |
| GE Vernova | GEV | Power | Gas turbines and power generation equipment | $1,064.50 | 31.57 | 285.59B | 75% | 22.5% | 2.5% | 155 |
| Lam Research | LRCX | Equipment | Semiconductor etch tools | $255.88 | 48.67 | 321.02B | 75% | 22.2% | 2.8% | 156 |
| Antero Resources | AR | Fuel | Natural gas | $38.89 | 12.72 | 12.04B | 72% | 28% | 0% | 156 |
| EQT Corporation | EQT | Fuel | Natural gas production | $58.67 | 11.39 | 36.71B | 71% | 29% | 0% | 158 |
| Freeport-McMoRan | FCX | Materials | Copper production | $56.62 | 30.66 | 81.28B | 76.9% | 15.4% | 7.7% | 162 |
| Digital Realty | DLR | Data Center | Data centers | $200.70 | 53.08 | 70.03B | 70.6% | 26.5% | 2.9% | 165 |
| Eaton | ETN | Grid | Electrical distribution equipment | $425.55 | 41.45 | 165.06B | 69.7% | 27.3% | 3% | 167 |
| Siemens | SIEGY | Power | Turbines and grid infrastructure (ADR) | $148.74 | 26.00 | 232.09B | 73.1% | 19.2% | 7.7% | 169 |
| Williams Companies | WMB | Fuel | Pipelines | $75.54 | 35.75 | 92.39B | 74.1% | 14.8% | 11.1% | 174 |
| Corning | GLW | Networking | Fiber optic cables | $158.02 | 78.67 | 135.93B | 65% | 30% | 5% | 180 |
| Ciena | CIEN | Networking | Fiber networking | $538.22 | 335.04 | 75.66B | 63.6% | 31.8% | 4.5% | 182 |
| Carrier Global | CARR | Cooling | HVAC systems | $67.41 | 44.13 | 56.50B | 58.6% | 41.4% | 0% | 183 |
| Chevron | CVX | Fuel | Oil and gas | $190.55 | 29.17 | 380.36B | 65.5% | 27.6% | 6.9% | 183 |
| Kinder Morgan | KMI | Fuel | Natural gas pipelines | $32.43 | 22.17 | 72.38B | 50% | 46.2% | 3.8% | 208 |
| ArcelorMittal | MT | Materials | Steel | $56.85 | 13.81 | 44.51B | 55% | 35% | 10% | 210 |
| Trane Technologies | TT | Cooling | HVAC systems | $486.48 | 38.10 | 107.71B | 48.3% | 44.8% | 6.9% | 217 |
| 3M | MMM | Materials | Industrial materials | $142.50 | 28.27 | 74.33B | 45% | 50% | 5% | 220 |
| Thyssenkrupp AG | TKAMY | Materials | Industrial materials (OTC) | $11.89 | 40.05 | 7.40B | 50% | 40% | 10% | 220 |
| Bloom Energy | BE | Power | Fuel cells | $290.52 | -5024.11 | 82.70B | 46.7% | 43.3% | 10% | 227 |
| ExxonMobil | XOM | Fuel | Oil and gas | $152.75 | 23.03 | 635.16B | 43.3% | 50% | 6.7% | 227 |
| Shell | SHEL | Materials | Energy | $88.98 | 14.94 | 248.66B | 40% | 56.7% | 3.3% | 227 |
| Intel | INTC | Compute | CPUs and foundry | $99.50 | -150.85 | 500.94B | 31.4% | 58.8% | 9.8% | 257 |
| Range Resources | RRC | Fuel | Natural gas | $42.63 | 11.49 | 10.04B | 25% | 64.3% | 10.7% | 271 |
| Cleveland-Cliffs | CLF | Materials | Electrical steel (GOES) | $10.47 | -4.36 | 6.00B | 18.8% | 68.8% | 12.5% | 288 |
| Huntsman | HUN | Materials | Chemicals | $14.63 | -9.03 | 2.54B | 17.6% | 58.8% | 23.5% | 312 |
| Southern Copper | SCCO | Materials | Copper | $171.18 | 28.79 | 141.41B | 10% | 40% | 50% | 380 |
| Glencore | GLNCY | Materials | Mining (ADR) | $15.22 | 252.29 | 89.25B | N/A | N/A | N/A | N/A |
| Mitsubishi Heavy Industries | MHVIY | Power | Large gas turbines (ADR) | $29.32 | 52.24 | 98.92B | N/A | N/A | N/A | N/A |
| MTU Aero Engines | MTUAY | Industrial | Aircraft engines (ADR) | $170.32 | 16.03 | 18.36B | N/A | N/A | N/A | N/A |
| Park-Ohio Holdings | PKOH | Industrial | Industrial manufacturing | $28.54 | 16.31 | 411.94M | N/A | N/A | N/A | N/A |
Now given this large list of potential stocks, I asked the models to construct a portfolio. I asked both ChatGPT and Claude: What 10-12 stocks would it pick, how would it weight them, and why? I then asked ChatGPT to create HTML for these 3 tables with columns [Name, Weight]. For the Analyst's Recommendation table, take the top 12 and create a weighting based on relative scores. ChatGPT easily figured out how to do this.
Portfolio Comparison
Given the option of picking 10-12 names, Claude picked 11. I specified 12 for the third table, to match ChatGPT's recommendation
ChatGPT
| Company Name | Weight |
|---|---|
| Broadcom | 15% |
| Lam Research | 12% |
| Applied Materials | 11% |
| Eaton | 10% |
| Vertiv | 10% |
| Micron Technology | 9% |
| GE Vernova | 8% |
| Marvell Technology | 7% |
| Celestica | 6% |
| Trane Technologies | 5% |
| Freeport-McMoRan | 4% |
| Corning | 3% |
Claude
| Company Name | Weight |
|---|---|
| GE Vernova | 12% |
| Freeport-McMoRan | 11% |
| ASML | 11% |
| Equinix | 11% |
| Eaton | 10% |
| Vertiv | 9% |
| TSMC | 9% |
| Broadcom | 8% |
| Prysmian | 6% |
| Marvell Technology | 7% |
| Celestica | 6% |
Analyst Rating Score
| Company Name | Weight |
|---|---|
| TSMC | 9.81% |
| Celestica | 9.44% |
| Broadcom | 9.19% |
| Micron Technology | 8.79% |
| Comfort Systems USA | 8.50% |
| Cheniere Energy | 8.36% |
| Hitachi | 8.22% |
| Energy Transfer | 8.03% |
| POSCO Holdings | 7.56% |
| Howmet Aerospace | 7.45% |
| Chesapeake Energy | 7.34% |
| Applied Materials | 7.34% |
Subjectively, I preferred Claude's picks based on its explanation, but it's tbd which portfolio does best in practice.
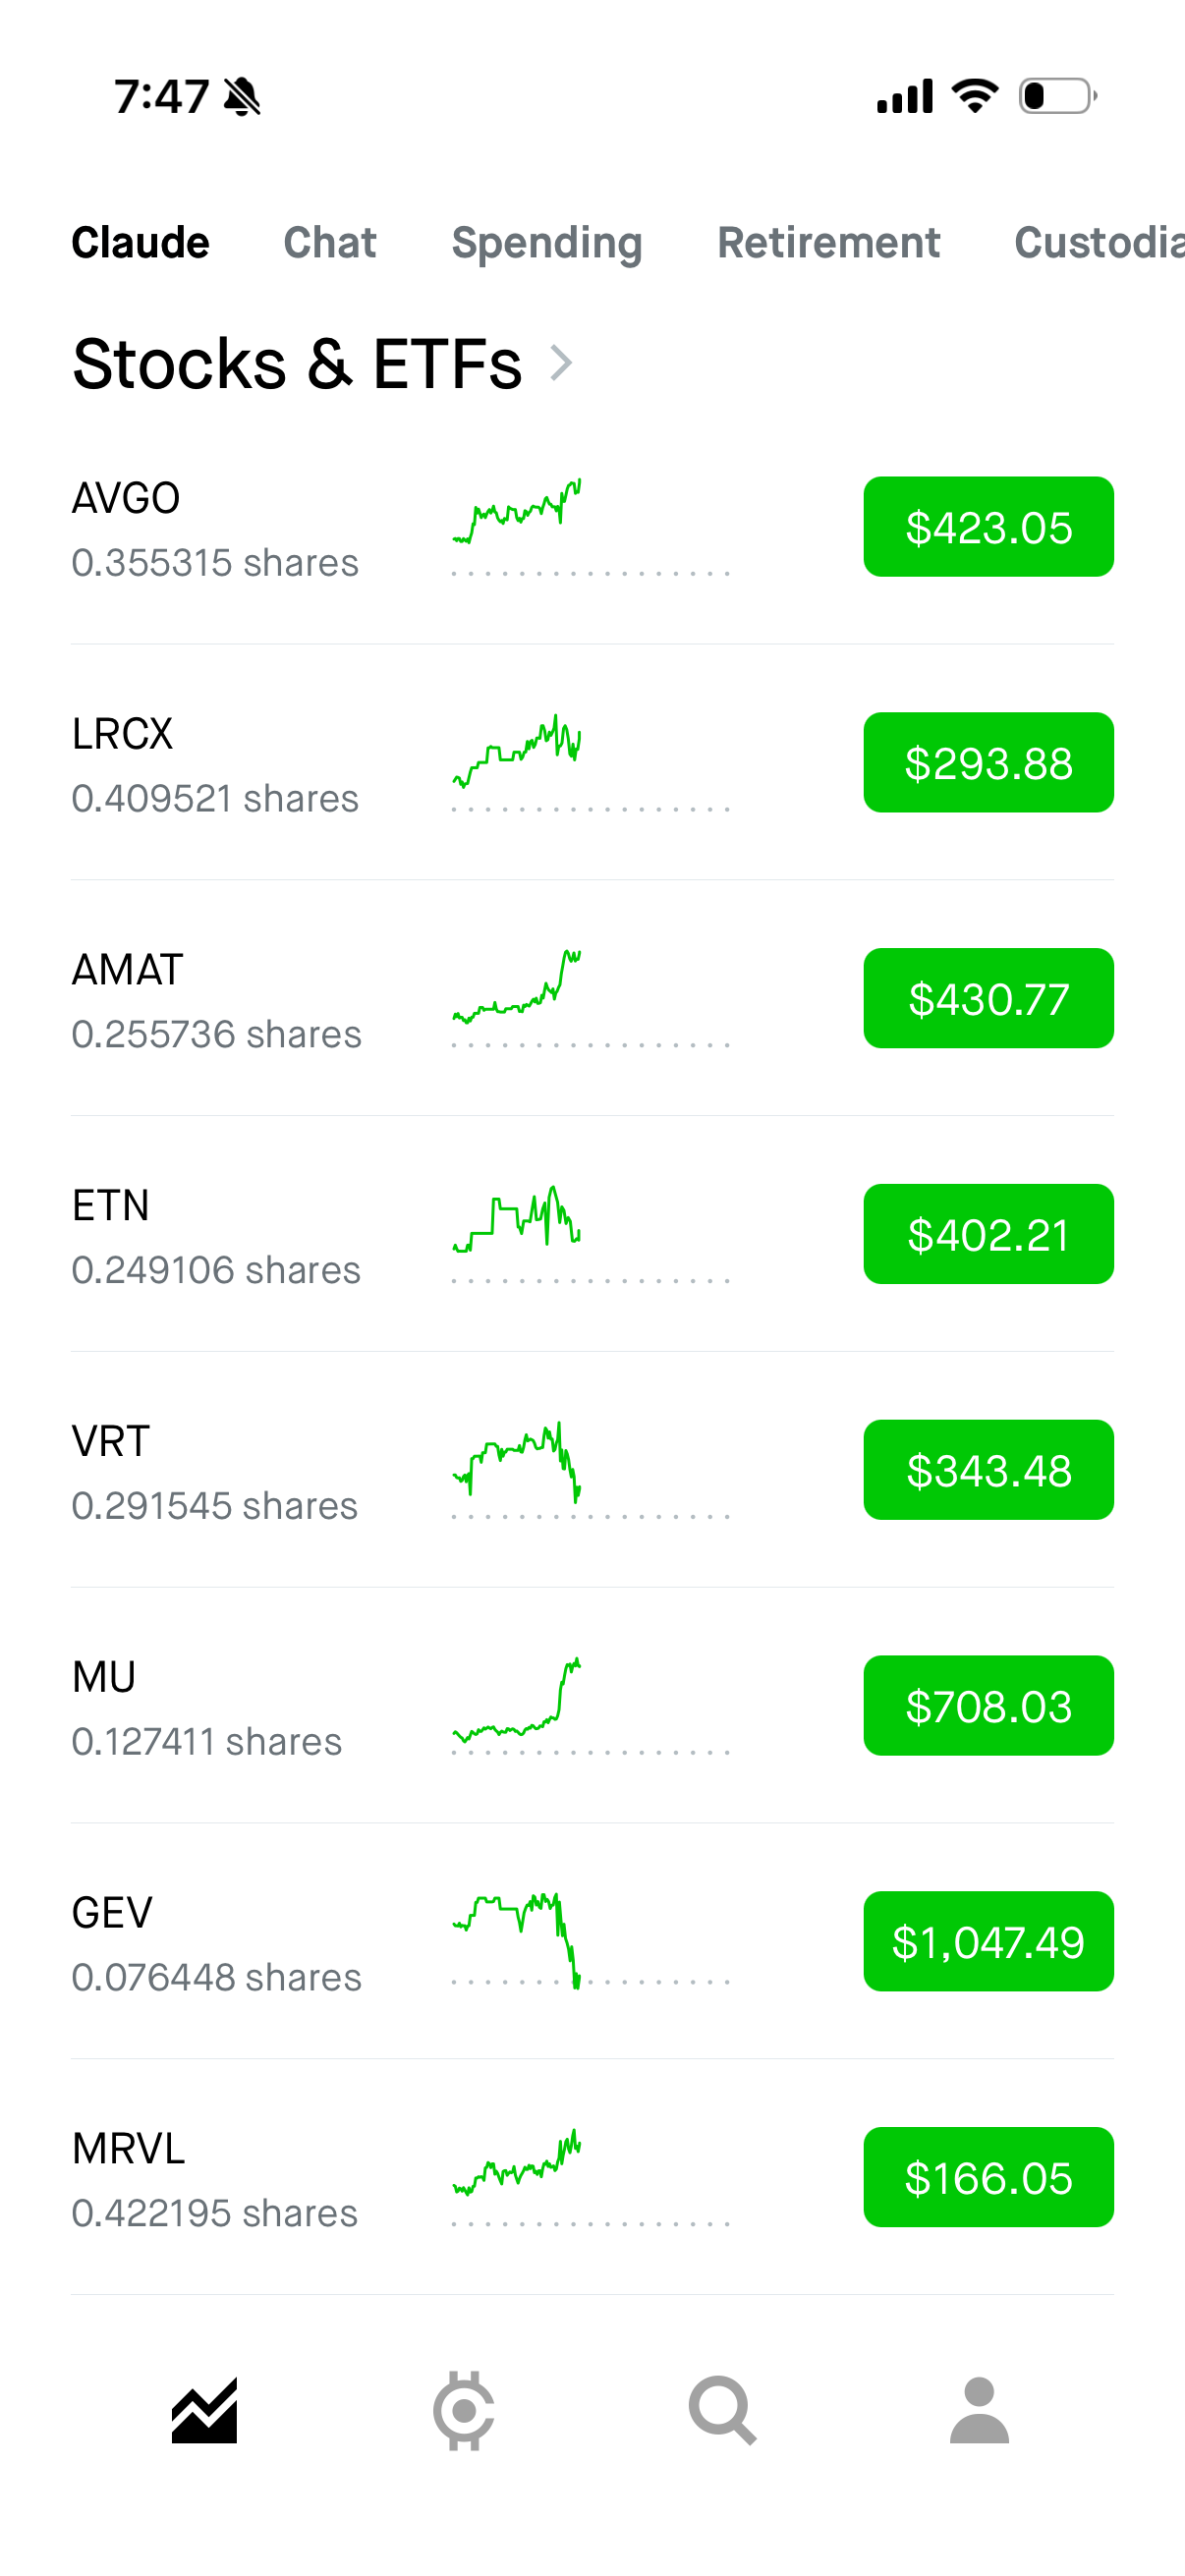
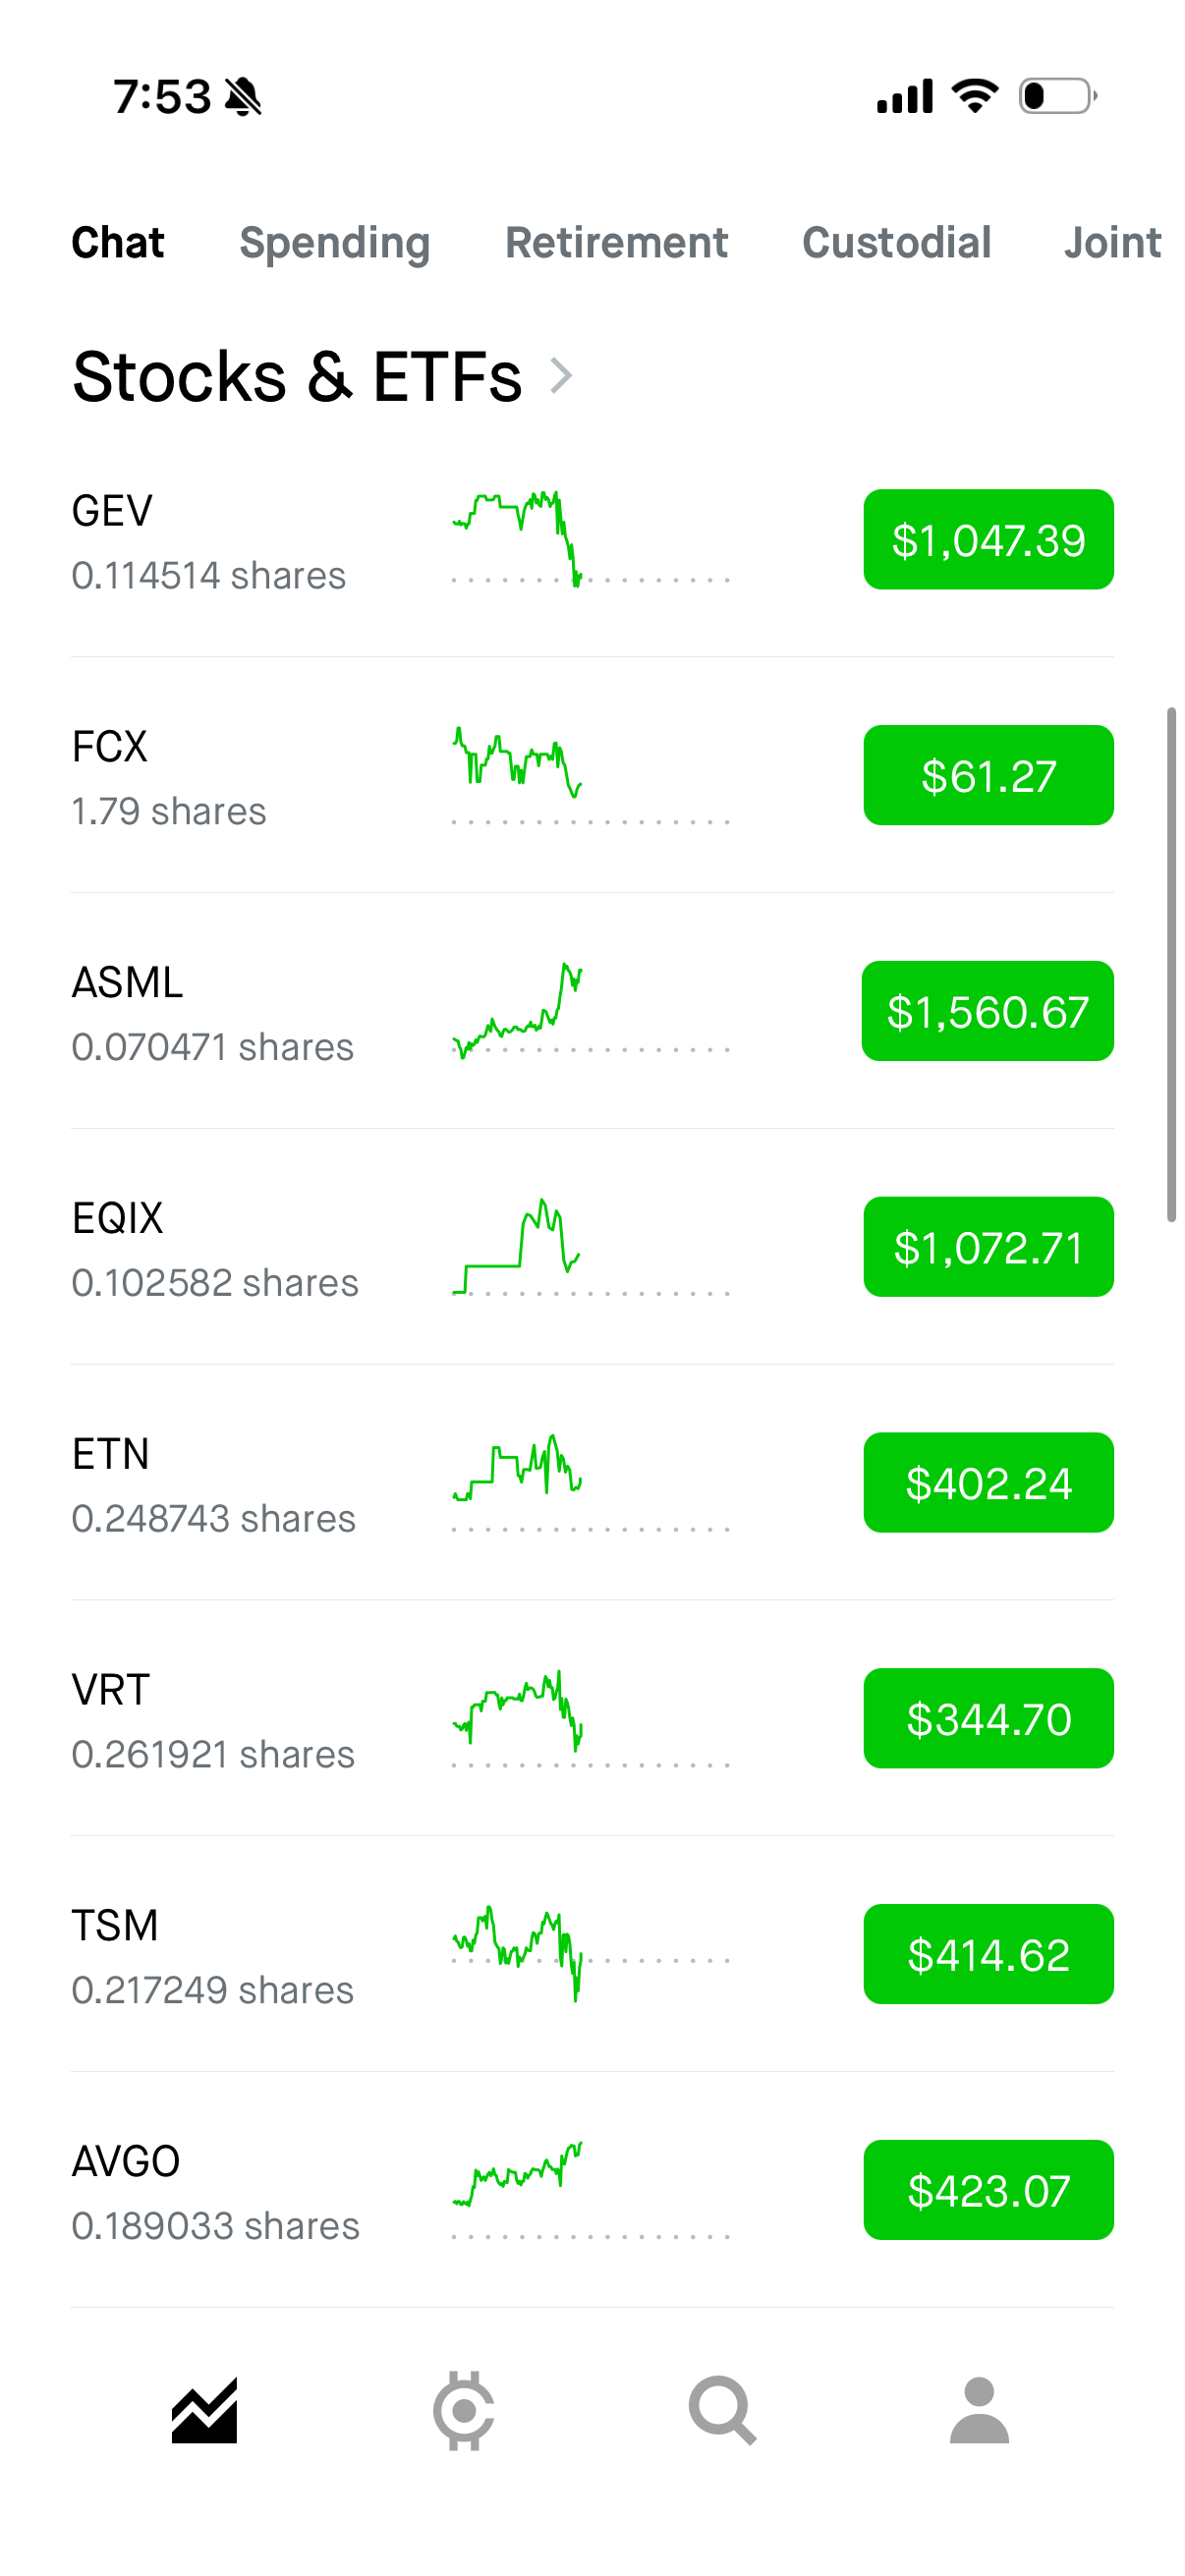
Robinhood conveniently allows you to buy fractional shares as well as set up different accounts. I have set up a Claude Portfolio account and a Chat Portfolio account. Let's see how they perform over the next months/years.
Learnings on Process:
- Using Codex for this project made scraping and formatting data very easy. Being able to switch between data formats seamlessly was incredible. I could easily provide text, CSV, screenshots, HTML, structured data in different formats, and the models would handle it.
- ChatGPT balked when asked to do large analyses. Asking it to enrich the data the way I did with Codex would not have yielded good results
- Building in this ad hoc way creates an overall workflow that is easy but not repeatable. It required jumping between tools, having a generator script, then editing the output of the generator, etc. Working like this leaves artifacts all over the place: multiple chat threads, locally saved CSVs, a small generator script, HTML outputs. For one-off analyses this is not really a problem, but it does diverge from how one might think about structuring a project in a pre-AI era. The tradeoffs of creating a repeatable system weren't worth it in this case since it was part research curiosity, part writing exercise, and part code. Only in this era does disposable tooling become economically rational.
- HTML is a great output format for these analyses. It offers maximal flexibility since there is already a robust system for formatting and interaction that models can reliably manipulate.
- The twists and turns are a part of the process. Had I known exactly what I wanted at the beginning, this would have been a very quick task. Instead, I added ideas iteratively as I learned and built. I view this as a creative benefit.
- The downside is, because it's so easy to take the next step, you may end up doing things suboptimally, or going down a rabbit hole. For example, instead of scraping Robinhood, which is brittle, I could have used the yFinance Python package. I did not even think about this because I had it in my mind that I was going to open these position in Robinhood. Similarly, starting with a ChatGPT-generated list of stock names and then picking 12 from there is very likely suboptimal because it assumes that ChatGPT picked the right pool of names to begin with. It would be easy to try another approach like analyzing Dwarkesh / SemiAnalysis podcast content, for example.
What AI unlocks:
The set of tools available today makes doing arbitrary analysis easy and fun. For example, it would be trivial to rate stocks based on "coolest company logo" or CEO's astrological sign (pick a different example if you don't like my cute ones). Exploring these types of questions used to take too much time to justify.
A more serious example might be: allowing a middle-school teacher to see how students do in class based on where they sit. Before, that analysis would require technical skill and more time than a teacher would care to allocate. LLMs allow the teacher to become an amateur sociological researcher by collapsing the costs.
Building in this exploratory fashion leads to open-ended creativity and I'm excited to do more of it. Not knowing precisely where you're going becomes more of a benefit than detriment as the capabilities available shift the work further from planning to action. Historically, ambiguity was expensive, but today the cost of trying new ideas approaches zero. I expect that going forward, much of research, learning, and product development will take the form of broad inquiry driven by curiosity and play.
Update 6/10/26: Claude Fable 5 was released this week and people are already showing incredible examples of one-shotted analysis presentations, like a McKinsey style report on a brand new topic, or an interactive webpage showing travel times to all places on a map. This will further unlock the free exploration of topics, although I remain convinced that doing the process partly by hand results in a better creative process by forcing you to think, make new connections, and drive the direction of the research.